


Have you ever looked at a piece of property that seemed to tick off all the right boxes on your list, and then cringed at the price tag because it was wayyy too expensive?
This scenario has happened far too often to many Malaysians who are still in the process of finding their first home.
Want a unit that can fit your entire extended family and comes with an affordable price tag? It’s usually off to the outskirts you go!
Now though, the country is faced with an unprecedented crisis: The COVID-19 pandemic, and the ensuing Movement Control Order (MCO). Many will now be wondering: How will these 2 affect the prices of property?
There have been multiple news pieces and opinion leaders already weighing in on this matter, so we decided to approach this topic using previously recorded data and figures to help us make an informed hypothesis. Without further ado, let’s begin!
Will Property Prices Be Greatly Affected By COVID-19 And MCO?
Even as Malaysia endures its fourth week under the extended MCO, the Malaysia House Price Index has actually shown a positive growth since 1999, according to data from the National Property Information Centre (Napic).
What this means is that the market prices are in tandem with the supply. So there’s a healthy balance of the demand and supply in the real estate industry.
However, based on the PropertyGuru Malaysia Property Market Index (MPMI) report for Q2 2020, asking prices for property nationwide have been on a downward trend since Q4 2016, bringing down costs of home ownership.
PropertyGuru Tip
The MPMI is essentially a quarterly report, which tracks the asking prices of properties on the PropertyGuru website.
Those two factors, when combined, point towards a moderating growth that took place even prior to COVID-19 and the MCO.
And if we were to take a look at our closest neighbour, Singapore, the prices of private homes there have also decreased by 1.2% in Q1 2020.
This is amidst the COVID-19 outbreak and their own version of the MCO (they’re calling it a “circuit breaker”).
Back home in Malaysia, this ongoing moderating growth may play a part in buffering the decline, which will lead towards a sideways movement of the graph, or just a slight drop in prices.

If we were to take into consideration the more micro picture, the property type that may see a steeper decline in prices would be detached homes (they fared the worst with prices dropping by 13.6%).
Terrace homes showed the least volatility, with a low of -4.8%, whereas high-rises were nearly as resilient as terrace homes through both crisis and recovery.

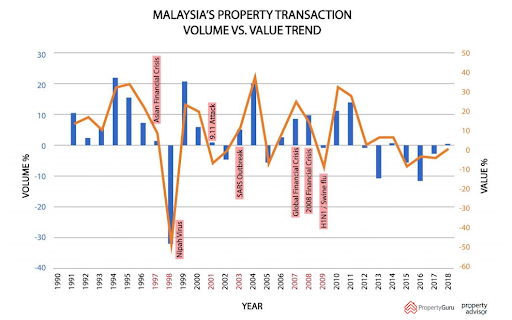
But, How Will These Events Affect Transaction Volume And Value?
Based on historical data, the volume of properties being bought and sold may decrease by up to 32.3%, and the overall value will see a similar trend by as much as 47.6%.
This historical data came from similar declines during the 1998 financial crisis and Nipah virus outbreak. However, we’re fortunate not to have a financial crisis this year, so the decline that we’re about to witness may not be as severe.
We’re also expecting to see an influx of hospitality assets on the market as some well-known hotels (like in Ipoh and Melaka) shut down operations for good.
A bit of good news though: The property market in China actually saw a healthy bounce back, with sales tripling in 30 Tier 1 and Tier 2 (read: major) cities in March!
It was, of course, a much-welcomed relief to the industry after the COVID-19 crisis nearly froze the market in that country.
Is There A Particular Place Or Type That I Can Focus On After This Crisis?
Now, if you’re wondering which areas and property types did well in previous recessions and viral outbreaks, you’ve come to the right place.
For the latest updates on transactions and areas in demand, property seekers can leverage on PropertyGuru’s AreaInsider!

From our data, we’ve gathered that in Q3 1999, demand peaked with 2-storey terrace homes in Sri Petaling. There was a total of 123 transactions, at a median price of RM149 psf.
By all means, this may not be the case this year, given the whole Sri Petaling tabligh cluster that led to the sudden spike in COVID-19 confirmed cases.
In 2004, 2-storey terrace homes were the most transacted properties 2 quarters in a row. This demand spiked in Mont Kiara, Desa Sri Hartamas, Kepong, Desa Parkcity, Sunway SPK Damansara, and Taman Bukit Maluri.
The median prices in those particular areas went from RM151 psf in 1999 to RM213 psf in 2004.
Over in Kuala Lumpur, serviced apartments were the most popular post-crisis properties in 2003 to 2004, and post-2008.
Serviced apartments | |||
|
Area
|
Period
|
Transactions
|
Median Price
|
|
Kuala Lumpur
|
Q4 2003
|
120
|
RM419 psf in Q4 2003 (62% rise from H2 1999)
|
|
Kuala Lumpur
|
Q3 2009
|
176
|
RM880 psf
|
|
Kuala Lumpur
|
Q4 2009
|
288
|
RM880 psf
|
However, serviced apartments and condominiums in Kuala Lumpur then became less popular since 2012.
This changed in 2019, with the national Home Ownership Campaign (HOC) helping to drive transactions to the sub-RM500,000 category.
It could be that serviced apartments tend to be concentrated in bustling, economic areas, and therefore at a premium.
Serviced apartments | ||
|
Area
|
Period
|
Median Price
|
|
Kuala Lumpur
|
2019
|
RM888 psf
|
|
Outside Kuala Lumpur
|
2019
|
RM355 psf
|
While transaction volumes have trended downwards in recent years, median prices (psf) have still managed to climb.
Terrace Homes | |||
|
Area
|
Period
|
Capital Appreciation
|
Median Price
|
|
Mukim Kuala Lumpur
|
1999–2019
|
304%
|
RM186 psf (1999) to RM752 psf (2019)
|
|
Mukim Kuala Lumpur
|
2009–2019
|
144%
|
RM308 psf (2009) to RM752 psf (2019)
|
|
Mukim Batu
|
1999–2019
|
198%
|
RM151 psf (1999) to RM451 psf (2019)
|
|
Mukim Batu
|
2009–2019
|
84%
|
RM232 psf (2009) to RM451 psf (2019)
|
When we come to Mukim Petaling, condominiums were the most popular properties from 2009–2019.
Condominiums/Service Apartment | |||
|
Area
|
Period
|
Capital Appreciation
|
Median Price
|
|
Mukim Kuala Lumpur
|
1999–2019
|
139%
|
RM356 psf (1999) to RM852 psf (2019)
|
|
Mukim Kuala Lumpur
|
2009–2019
|
108%
|
RM409 psf (2009) to RM382 psf (2019)
|
|
Mukim Petaling
|
1999–2019
|
304%
|
RM158 psf (1999) to RM382 psf (2019)
|
Capital Appreciation vs Property Type (2015–2019) | ||
|
Property Type
|
Area
|
Capital Appreciation
|
|
Terrace homes
|
Mukim Kuala Lumpur
|
5%
|
|
Terrace homes
|
Mukim Batu
|
-13%
|
|
Serviced apartments
|
Mukim Kuala Lumpur
|
3%
|
|
Serviced apartments
|
Mukim Petaling
|
-11%
|
Overwhelmingly, we see that 2-storey terrace homes were the most preferred property type in Selangor, Kuala Lumpur, Penang and Johor during the post crisis years of 1999, 2003, and 2004.
This changed in the post-crisis year of 2009, where Kuala Lumpur and Penang instead saw an increasing trend for high-rise developments such as flats, apartments, condominiums, and serviced apartments.
In 1999, transactions peaked in Q4 with 868 2-storey terrace home transactions in Mukim Damansara. These transactions were concentrated in Subang Jaya and USJ.
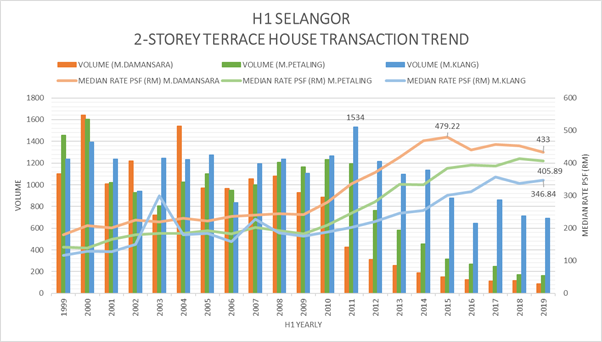
2-storey terrace homes remained popular until Q4 2004, peaking with 602 transactions. While remaining popular, the number of transactions for this particular property type has moderated in recent years.
Double Storey Terrace Homes | |||
|
Area
|
Period
|
Capital Appreciation
|
Median Price
|
|
Mukim Damansara
|
1999–2004
|
30%
|
RM179 psf (1999) to RM233 psf (2004)
|
|
Mukim Klang
|
1999–2004
|
115%
|
RM116 psf (1999) to RM250 psf (2004)
|
|
Mukim Petaling
|
1999–2004
|
24%
|
RM174 psf (1999) to RM216 psf (2004)
|
Can I Focus On The Areas Mentioned When House Hunting?
While you can use the information we’ve provided to come up with your own educated guess, do note that as projections today are based on historical data, there’s still the major element of uncertainty.
We strongly advice you to do all the necessary research and practice a holistic home ownership.
This means that you shouldn’t just look at the initial costs associated with owning the property, you also need to ensure you’re financially stable to sustain the monthly instalments, while managing your other necessary expenses well!
Keep Track of New Launches
Visit our new launches page to find the new launch project of your dreams and submit an enquiry today.

Disclaimer: The information is provided for general information only. PropertyGuru International (Malaysia) Sdn Bhd makes no representations or warranties in relation to the information, including but not limited to any representation or warranty as to the fitness for any particular purpose of the information to the fullest extent permitted by law. While every effort has been made to ensure that the information provided in this article is accurate, reliable, and complete as of the time of writing, the information provided in this article should not be relied upon to make any financial, investment, real estate or legal decisions. Additionally, the information should not substitute advice from a trained professional who can take into account your personal facts and circumstances, and we accept no liability if you use the information to form decisions.